
One MCP Tool Call Can Burn Your Whole Token Budget
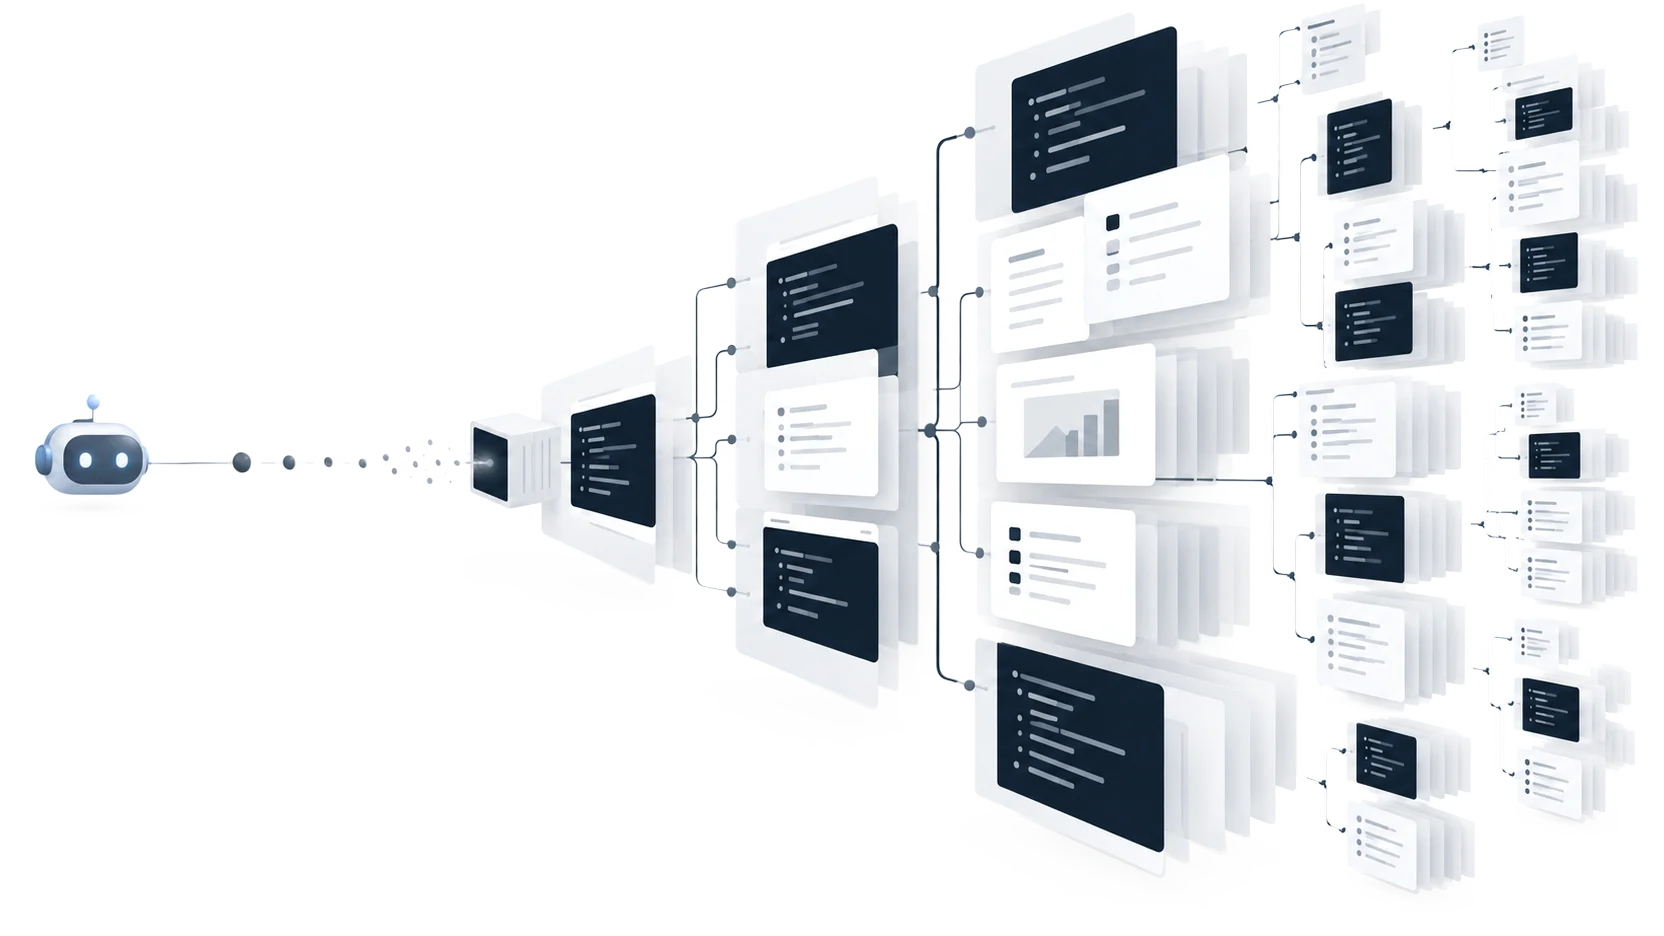
Where MCP server tokens go
Most advice about context engineering is about what an MCP server sends before any call happens: fewer tools, shorter descriptions, smaller schemas. That part is the same on every request, so hosts can cache it. Tool responses are new on every call, and when the server sits on top of a lot of data, that’s where the budget goes.
Opik, an open-source LLM observability platform, holds that kind of data. One project can hold millions of traces. A trace is one run of an agent, and a span is one step inside it, such as an LLM call or a tool call. Spans nest inside spans, and each one carries the full prompt, the completion, metadata, scores and usage.
Picture a user asking their coding agent “why did my agent start failing yesterday?” The answer is somewhere in those millions of nested JSON objects. If the server hands over whole records when the agent needs one field, a single call can fill the context window, and the user pays for those tokens with no idea which call spent them. After a few calls like that the agent is lost in giant JSON, and to the user it just looks weak.
When we built the Opik MCP server, every design decision followed one line from its first ADR (architecture decision record): every token the server puts into a host’s context has to pay for itself. In practice it means every answer says how big it is and what was left out of it.
The rest of this post follows the agent through that question, one call at a time. The tool list itself is covered in MCP tool design for agents.
Three levels of detail for every tool response
A person debugging in the Opik UI scans a table, opens one trace and expands one panel. We gave the agent the same moves. Any object can come back as a skeleton with a few columns per row, as a medium answer with only the fields the agent names, or in full. The agent picks the level on every call, so it sees the shape of the data before it pays for the contents.
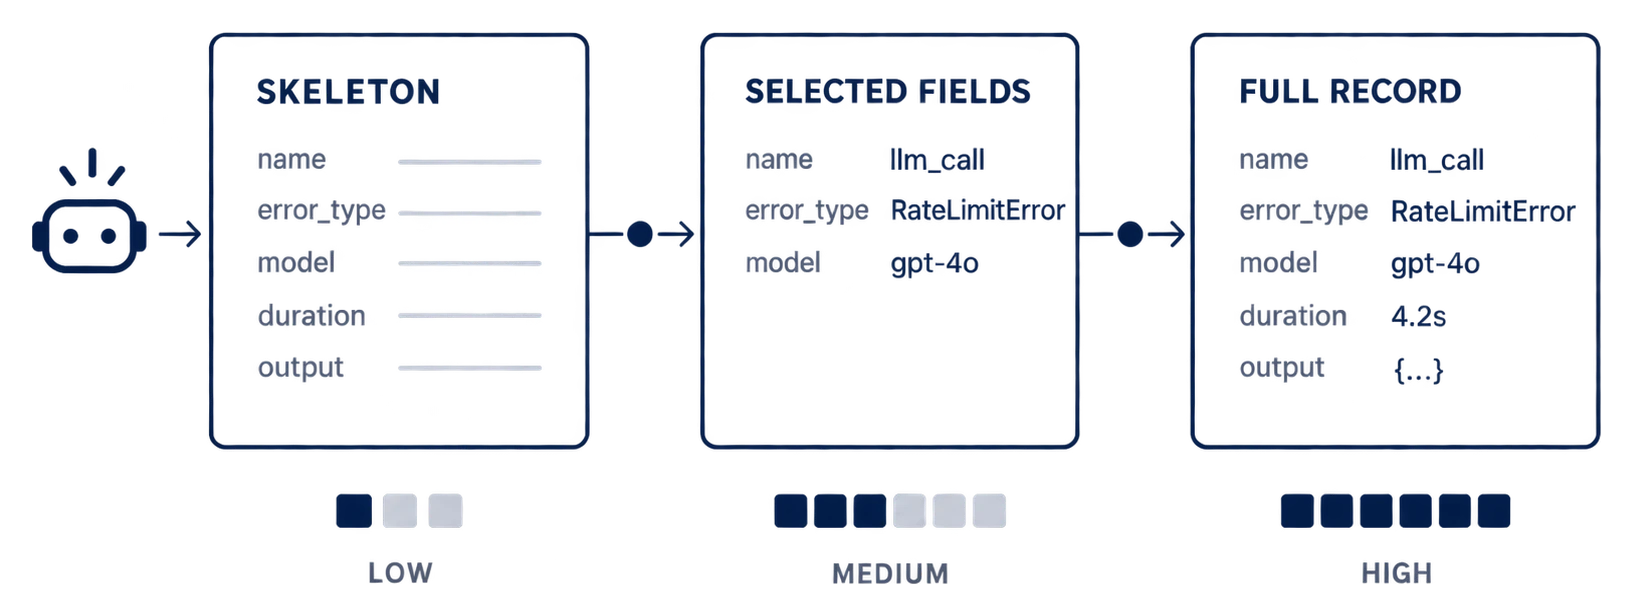
The server never chooses the level for the agent. If it chose by token budget, a failing run with hundreds of spans would get squeezed into a skeleton, and a skeleton has no error details. The read most likely to be cut would be the one asking why something failed.
Step 1: a look at the project
For a question like this, reading the project is often the best first call. It returns the numbers from the summary cards on the Opik Logs page (trace count, error rate, average duration and total cost, next to the previous window) and the latest activity. It also returns the project’s vocabulary: the score names, usage keys and online rules in use, plus the metadata keys of recent experiments, so the agent doesn’t have to guess a name and get an empty page back.
That read fans out to several backend calls, and some of them can fail. If the project record itself fails, the whole read fails. If an extra part fails or times out, its slot holds {"error": "Could not load …"}, and an error rate over no traces is null. A zero in either place would read as a healthy project, and someone would act on it.
Step 2: which traces failed
Now the agent asks for the skeleton, a list of the traces with errors from the last day:
list(
    'trace',
    project_name='demo',
    since='24h',
    filters='error_info is_not_empty',
)
It gets back a table of up to 25 rows (the default page size), without the bodies:
id | name | start_time | duration_ms | error_type | total_estimated_cost
…  | …    | …          | …           | …          | …
A page renders as a pipe-delimited table because a model scans it more easily than nested JSON, and the column names appear once, at the top. Cells stop at 60 characters, and the cuts are counted under the rows. A column the filter fixed to one value is dropped, because it reads the same on every row and the header already states it. In one live test, an optimization_id = "…" filter repeated a 36-character id down the page, a tenth of its bytes.
If most rows share one error_type, the agent knows what broke before it has read a single body. Under the table, a fields: line lists what it can ask for next, such as error_info.message or a custom key like metadata.region.
The first line of the answer is a header:
[list: trace | 1,234 tok | filters: error_info is_not_empty AND source = "sdk" | since: 24h (2026-09-23T10:03Z)]The token count lets the agent plan. If a page costs 4,000 tokens and it needs ten more pages, it should narrow the query first. The server counts 2.5 characters per token, because JSON tokenizes worse than prose (one answer of 25,422 characters came to over 10,000 tokens), so the estimate errs high. The header also shows what the agent never typed: the default source = "sdk" filter that keeps evaluator, playground and experiment traces out, and the exact time since: 24h started.
An empty page would tempt the agent to conclude that nothing failed, which is why an empty list carries one hint. When the project’s last trace landed before the window started, the answer says Last trace in this project: …, before your window. Otherwise the server runs one-row probes to see whether the default filter or the agent’s own filters hid the rows.
Step 3: which steps failed
A trace usually fails because one step inside it failed, and the next call lists the failing spans, this time naming only the fields it needs. This is the medium level:
list(
    'span',
    project_name='demo',
    since='24h',
    filters='error_info is_not_empty',
    fields=[
        'trace_id',
        'name',
        'model',
        'error_info.message',
    ],
)
If the failing spans share one model and one message, the agent has its lead after three calls.
An answer with only some of the fields looks a lot like a small but complete record. Twenty turns later the agent could forget the difference and reason from data that was never there. So the header echoes the fields it asked for, and a line under the rows starts with projected:, counts the fields that were left out and names them. Every row keeps its id, so the agent can widen the read without searching again. The fields option only selects paths, with no jq or expressions, so what comes back is always a subset of the full record.
Step 4: the whole trace
To see the prompt that went out and what came back, the agent reads one span with two fields:
read(
    'span',
    '<span-id>',
    fields=['input', 'output'],
)
A read like this carries a | projected tag in its header, and the line under it says that the same read without fields returns the record whole. If the agent needs everything that led up to the failure, it reads the whole trace:
read('trace', '<trace-id>')The spans inside come back slimmed. The Opik backend cuts each of their fields at about 10,000 characters, and the span bodies share a 14,000-character budget: past it, a span keeps its place in the tree and loses its body. At most 200 spans are inlined. A run with 250 spans can’t fit, and the answer says so:
200 of 250 spans inlined; the rest: list('span', project_id='…', filters='trace_id = "…"', page=3, size=100)Prompt versions and the project vocabulary are capped the same way, with a count and the call that returns the rest.
Step 5: handing the answer back
The user asked the question, so they need a way to check the answer. A trace id in a chat message doesn’t help with that, so every read carries the url of the record’s page in the Opik UI, and every list page carries either one url_template the agent fills from each row or a url on every row. The server instructions tell the agent to put the link on the record’s name every time it names one: ten rows mentioned means ten links. The user can then open the failing trace and look at it themselves. Writes to traces, spans and threads return a link too when the project id is known, so the user can see what the agent changed.
Links are never guessed. A record without a page gets a url_absent sentence saying why, and when the server doesn’t know the UI address or the workspace, there is no link at all. The Opik UI is project-scoped and still serves its retired link shapes through a shim that fills in the project the reader last opened, so an old-style link would open a real page in someone else’s project. Every link goes through one builder that only produces the current shape.
When the agent gets a call wrong
The filters string in these calls uses one small query language for traces, spans, threads and every other type that takes a filter: a field, an optional key, an operator and a value, joined with AND.
error_info is_not_empty AND duration > 5000
metadata.region = "eu" AND name starts_with "llm_call"
A query with OR is refused with “OR is not supported; use AND, or run one query per alternative”. Every other filter is checked against the backend’s field tables before anything is sent, and all the problems come back in one answer. An unknown field gets the closest real name (Did you mean 'duration'?), a bad operator gets the operators that the field accepts, and a bad value gets the expected format. Without that, the agent would fix one mistake per round trip and pay for a backend call each time. Sort fields are checked too, because the backend silently ignores one it doesn’t know, and an agent asking for the slowest traces would report an unsorted page as sorted.
Other errors are one sentence about what was asked and what to change. The backend’s response body never goes back to the agent, because it is untrusted text that can contain instructions. The exception is a 400, 409 or 422, where the backend’s reason is usually specific, so it is passed on, capped at 200 characters. A failed write returns compact JSON with the issues and a working example. The full JSON Schema took up to 3,219 characters per failed write, so it waits behind schema("thread.close") until the agent asks.
Duplicate output and tool description size
Two costs never show up in the headers above: a second copy of each answer, and the tool descriptions loaded before the first call. A tool that declares an output schema has to send structuredContent next to the text, so every answer crosses the wire twice. Over the in-memory transport in the tests, read_skill('opik') sent 8,962 characters of text and 9,439 of structured content carrying the same string. Hosts show the text and keep the copy for programs, so the agent gains nothing from it. FastMCP infers an output schema from each tool’s return type, so every tool here declared one. The server turns that off, and a test fails if any tool declares one.
Tool descriptions cost tokens in every session, and they tend to grow by a sentence per PR. In this server the tests set the limits: 24,000 bytes for everything tools/list advertises (names, descriptions, input schemas, titles and hints) and 5,000 for the initialize instructions. Claude Code also cuts each tool description, and the server instructions, at 2,048 characters without a warning, so the tests check that limit too. The read and write descriptions and the instructions are still over it, marked as expected failures until they fit, and any PR that adds context states what it costs.
MCP server design checklist
If you are building an MCP server over a lot of data, these are the habits that let an agent answer a question like ours without reading the data first:
- Give every object a skeleton, a medium and a full size, let the agent choose, and list the fields it can ask for.
- Put the token cost on the first line of every answer, and send each answer once.
- Return lists as tables, mark projected answers, count every cut, and name the call that returns the rest.
- Put a link to the UI page on every record, and never build one by guessing.
- Explain empty results, and never show a failed lookup as a zero.
- Validate queries locally and return every issue in one answer.
- Keep tool descriptions under a byte budget that the tests enforce.
The server is open source, with the ADRs, design docs and tests behind the measurements above. If you’re building an MCP server over your own data and hit a case these rules don’t cover, I’d like to hear about it on LinkedIn or X.